After getting some basic data sets up and rendering with my GPU based sparse voxel octree ray-caster I wanted to get stuck in to actually using it to render planets. Now as I've discussed before planets are pretty big and dealing with them can throw up many numerical precision issues for algorithms. Having dealt with these in past projects however it seemed daft to reinvent the wheel so I spent some time porting the general solar system simulation code from Osiris into Voxelus. This was made more complicated and time consuming as I started a whole new C++ framework for Voxelus rather than use what was becoming a very old and messy utility library - it was time well spent though as I believe it's healthy to have a clean slate now and again.
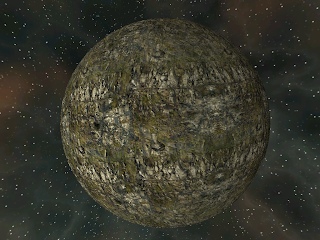 |
| Very first voxel planet (256^3 grid) |
With that done though I could bring across the procedural nebula backdrop generator which with a couple of colour tweaks just for fun at least gave me a nice cubemap backdrop. Above is my very first voxel planet, rendered using a 256^3 data set as source for the SVO with tri-planar texture mapping to give it some interest. The distance field from which this is generated is really just "distance from surface of sphere" so it's neither particularly interesting nor showing the power of voxels, but it's a start.
Modelled as an earth side planet, the 256^3 data makes each voxel almost 50 Km on a side!
Now perfect spheres can only be so interesting, so adding some relief detail was my next job. Although completely arbitrary shapes are possible with voxels I wanted to get started with some fairly traditional planet forms so the initial focus was on producing something reasonably realistic. I've used a variety of fractal functions in the past to simulate terrain, ridged multi-fractals being a popular choice but such terrains tend to suffer from a large degree of homogeneity - they tend to have a large degree of self-similarity especially across large areas even when combining numerous frequencies.
In the spirit of trying new things, rather than tread that worn path again I wanted to try something different for Voxelus. Rather than generate heightfields from fractals, I wanted to see if I could generate something suitable using real-world Digital Elevation Model (DEM) data. A little searching turned up the
Shuttle Radar Topography Mission (SRTM) data which is available in a variety of resolutions. Downloading this and writing a little command line tool to load and cut out interesting sections of it enabled me to produce a library of DEM tiles that I could use.
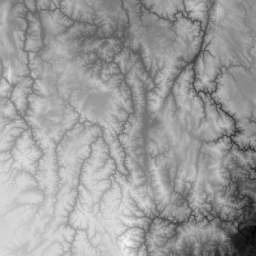 |
| Two examples of DEM patches my tool cut out of the massive SRTM 500m data set |
I used a simple height histogram to choose areas where there was a lot of variety in elevation in an effort to make the final result more interesting - although the SRTM 500m data set is hundreds of MB in size, a surprising amount of the Earth's surface is in fact pretty damn flat!
Armed with my library of DEM tiles I needed a way to map them onto my planet. Mapping 2D squares onto a sphere is however a classically impossible task (ask any cartographer) so rather than being able to make some perfect mapping I instead needed to quilt the surface with overlapping tiles, using as few as possible while ensuring that there were no gaps in between. I also wanted to be able to quilt at various resolutions so I could combine several "octaves" of DEM data in a traditional fractal-esque fashion.
To do this, I based my mapping on an
Icosahedron, a regular polyhedron made up of 20 triangles.
 |
| Icosahedron (image from Wikipedia) |
The key attraction of the icosahedron is that each side is an equilateral triangle producing an even distribution of surface area, and that each side can be recursively subdivided into four smaller equilateral triangles to produce higher and higher detail meshes with the same characteristic. By normalising the position of the vertices introduced by these subdivisions an increasingly high quality approximation to a sphere is achieved.
To map my DEM tiles onto the sphere I treat each triangle of the icosahedron as representing one tile. The centre of the tile lies on the centroid of the triangle and extends outwards to cover the triangle completely. Each tile also has a random rotation around the centroid so to ensure that there are no gaps between the tiles from adjacent faces, the tile has to be twice the radius of the triangles circumscribed circle in size. There will be considerable overlap around the edges between adjacent tiles but that's all the better to avoid seams.
 |
| First "octave" of DEm tiles at primary icosahedron vertices, there are 12 tiles here |
 |
| One further level of subdivision produces 42 smaller tiles |
 |
| Subdividing again produces 162 even smaller tiles |
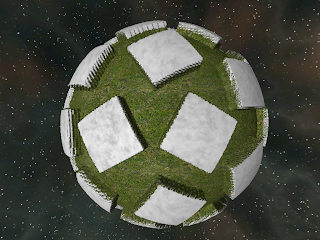
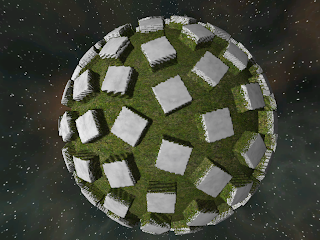
These three images are to visualise how the tiles are distributed on the sphere. These examples actually have the tiles at the vertices rather than the triangle centroids but I later switched to the centroids as I thought it gave a better result. Centroidal tiles produce 20, 80 and 320 tiles at each level respectively. The tiles here are artificially smaller than final size simply to improve the visualisation.
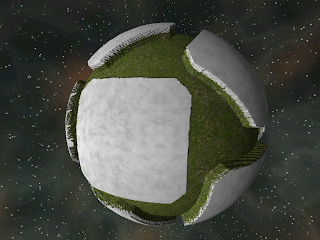
Expanding the tiles to their correct sizes and repositioning them at the triangle centroids rather than the vertices produces a more accurate result:
Here the individual tiles have been tinted to aid identification and the edges shaded green based upon the weight of their influence at that point. As you can see the weight of each tile fades off towards it's edges to avoid hard seams and there is no space between them regardless of their orientation to ensure a complete mapping of the sphere. I've added a simple directional light so the relief from the DEM data can be seen.
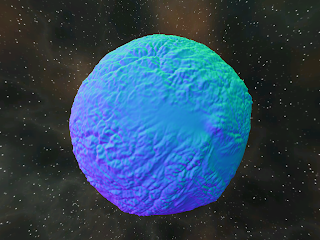 |
| Normals from just the basic level #0 data |
Here the voxel normals can be seen, note that this is using just the 20 tiles from the level #0 quilting but with a mountain height of about 500 Km to make detail obvious from such a distance - by comparison Mt. Everest on Earth is just 8.8 Km tall.
Finally here is the same level #0 data with some basic elevation/slope based texturing applied. Even with just one level of DEM data I am quite pleased with the appearance of the terrain, particularly with the variety of landscape forms in evidence which encourages me that this technique might just be viable.
The coarse 256^3 nature of the data can be quite clearly seen in this image even from this distance so I think starting work on the dynamic resolution subdivision system for closer views might be next on the list of things to tackle.


